Visio Services in SharePoint 2010 – Part 1
December 17, 2009 30 Comments
Introduction
This is Part 1 of a series of articles on Visio Services. One of the most exciting new features of SharePoint 2010 is the new Visio Services which enables you to publish data-bound Visio Diagrams to the web to view in either a full page screen or in a web part. It’s a fantastic new addition to your arsenal of functionality within SharePoint and allows you to display data in new and original ways, or add real value-add to traditional ways of showing information. For example, one of the classic uses of Visio is to draw up diagrams of your Server Farm.
The samples here have all been produced with the Beta 2 release, and the final release may or may not have all of these features – but I hope it does!!
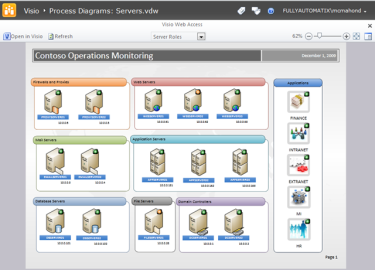
So take a look at this diagram rendered in Visio Services in SharePoint 2010 which shows a fictitious network layout based on server role:
A number of things about this diagram are:
The diagram is rendered in Silverlight, but if company policy does not allow Silverlight it will be rendered as a PNG.
The diagram is zoom-able and pan-able and you can easily re-centre the diagram using the controls on the upper right.
You can refresh the diagram by itself using AJAX without having to re-render the whole page.
You can show multiple pages on a diagram using the page drop down in the middle.
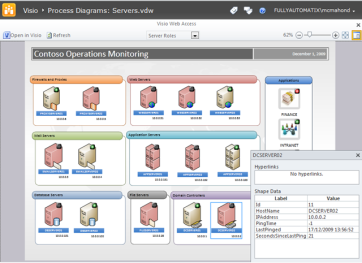
The diagram is data-bound. The colours of the servers indicate the health of the servers. If connectivity is lost, the servers change from their natural colour , through a disgusting pink to a more serious red! See Figure 2 below. In addition the traffic light icon at the top right shows the speed of reply from a standard ping. If the light is green, then the ping has responded in quick-time, amber a longer period, red a longer period still and if it goes black then the ping failed.
The diagram is bound to two different data-sources. One is a SQL Server Database View which in the right-hand column indicates the health of various business critical applications, the remainder of the page is linked to a second data-source which is another SQL Server View and shows the status of the individual servers.
In the far right on the top bar is a button which toggles the shape-data grid which displays the custom data items for each of the shapes. This is shown in Figure 2 as well.
Notice also a new feature of Visio 2010. Containers. These are the boxes which group the server shapes together. I think they are simple and very cool, they again make the representation of information easy.
There is a wide range of features available to you to help you develop engaging and exciting intelligent diagrams using Visio Services.
Data Sources
You can connect to a whole range of data sources. SQL Server Databases, Excel Spreadsheets, SharePoint Lists, OLEDB and ODBC data-sources and if that doesn’t suffice, the framework is extensible and you can create your own custom data provider. We’ll take a look at how to do that in a later part.
Shapes and Icons
You can create your own icons and probably other types of Data Driven shapes and we’ll also take a look at that in a later Part.
Javascript API
In order to provide some additional capabilities, there is a JavaScript API available to allow you to interact with your Visio Services Diagrams and connect them to items on your web page.
Web Part Connections
Finally you can use Web Part Connections to link other web parts to Visio Services Web Parts and Visio Services WebParts to each other.
Some more Samples
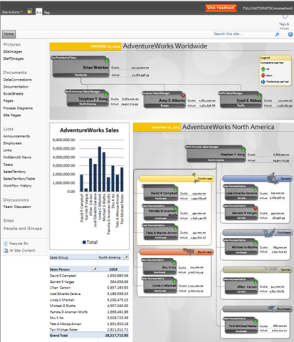
Here’s a few more screenshots of some other Visio Services Diagrams. The first one shows two Visio Services diagrams on the same page within web parts, they are connected using the JavaScript API. You can also see an Excel Services chart on the same page;
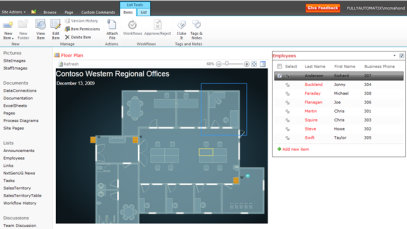
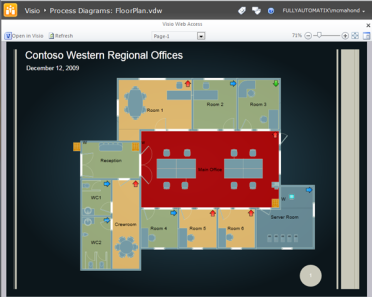
The next one shows a floor plan connected to a SharePoint list using Web Part Connections which allows you to highlight various areas of the Visio Diagram.
Finally the last one shows another floor plan but linked to a Custom Data Provider which supplies room temperature. As the data changes, i.e the room temperature changes, it indicates through colours the actual temperature, and through the icons the direction in which the temperature is moving, up, down or staying constant.
Getting Started
So how do you get a Visio Services diagram together? It’s pretty easy really. Here are the steps you need to take:
- Identify the Data Source you want to connect to.
- Create your Diagram in Visio 2010.
- In Visio 2010, link your shapes to your Data Source.
- Publish your Diagram to a SharePoint Server directly from Visio 2010.
- Click on a link in a SharePoint list to view the diagram in full screen mode or create a WebPart page and add in the Visio Graphics Web Part and set the URL of the diagram you wish to view.
Those are the steps and we’ll take a look at them in a bit more detail in Part 2 of this series. This posting was really just a taster of things to come …
Cheers
Dave Mc
Great article. Are you able to send a copy of the visio diagram or detailed instructions of how you created this.
Thanks
Hi Matt,
Thanks for the kind comments. Which particular diagram were you interested in?
Cheers
Dave Mc
Dave,
This is pretty awesome. I was wondering if you could possibly send me the “telephones” visio diagram that you used in this article? I’d be interesting in knowing how to link the information from one list to diagram as well.
Thank You,
Jerry
Hello Dave,
Great article, I’m interested in doing something similiar to show User Floor Plan, maybe using information from the User Profile Service in SP2010… Could you point me in the right direction? (Assume I know nothing!!)
Kind Regards,
Dayna
Hello Dave,
This is a great article indeed, and I’m in interested in accomplishing both the Operational Process and a Detailed Floor plan, do you have the Visio’s for the Operational Diagram referenced you can share out?
Hi Terry,
Sorry which diagram did you want? The server diagram?
Cheers
Dave Mc
Hi Dave,
By the way, may I know where is the part 2 of this guide. I am interested to know how you tackle the floor map using visio and later link to SharePoint data source. (Probably, you can discuss further at this site: http://social.technet.microsoft.com/Forums/en-US/sharepointgeneral/thread/dab8c399-d6ad-410f-8d42-31b473ba278b)
By the way, it would be helpful if you have the guide for both SharePoint 2010 and also SharePoint 2007. (Most of the company are still using SharePoint 2007.)
Hi,
Part 2 is in my brain still – sorry!!
First off , obviously Visio Services only works in SharePoint 2010, but the Shapes data binding works in Visio 2007 and so you could upload and deploy data bound Visio diagrams in Office 2007 and host them in Sharepoint 2007, you just can’t view them in the browser, they would be just downloadable files.
The floor map is done by binding to a custom data source which is a custom component which inherits from AddonDataHandler and implements IAsyncResult. the custom data source linked, in the example to an XML file on the file system which was refreshed by an external process. I’ll try to get around to publishing an article on how its done soon – just a bit manic at the moment!
Cheers
Dave Mc
Hi Dave,
Have been looking for your Part 2 since Sep 1 2011 and I think a lot of people out there is also very interested in your Part 2. (It is getting a lot of attention.) Would appreciate if you can post your Part 2 soon.
Also, would like to know if there are other ways to view the Visio 2007 map in the browser. Not all the company are using Visio 2010 or SharePoint Server 2010. Would appreciate if you can provide a Visio 2007 map that interact with SharePoint 2007 in a web browser. (probably can include in your Part 2).
Thanks.
Hi – Part 2 was published a few weeks ago 🙂 https://davemcmahon81.wordpress.com/2011/12/15/visio-services-in-sharepoint-2010-part-2/ – enjoy! Only Visio 2010 is able to do the conversion from the VSD file format to the VDW file format which is the file format which Visio Services knows how to render. Visio Services is not available in SharePoint 2007, unless you care to implement it from the ground up yourself … :-). Thanks for the comments, appreciated.
Cheers
Dave Mc
Dave,
This is pretty awesome. I was wondering if you could possibly send me the “telephones” visio diagram that you used in this article? I’d be interesting in knowing how to link the information from one list to diagram as well.
Thank You,
Jerry
I’ll see what I can do … I need to dig out the diagram … been a while since I looked at this 🙂
Pingback: Office Layout Management System
Hi
I’m interested two in the telephones visio, im looking to build a portal linked with asset sql db for user self service printer mapping with a .js script
Hi,
Do you have a download file – .exe (?) that will install an app to auto-extract (web services?) part 2 from your brain?
lol 🙂
I’ll do my level best to try to do a Part 2 over the next month (during my Christmas Break) – deal?
Cheers
Dave Mc
Great Great article, I was looking a sample for people localisation in a building, can you please send me the sample about floor plan connected to a SharePoint list .
thank you so much
Looking forward to part 2
😎
Don’t all faint with shock … I have actually started writing Part 2 … honest!
Also guys, can I refer you to http://www.simple-talk.com/dotnet/.net-framework/sharepoint-2010-visio-services/ which is an article I wrote on Visio Services a while back.
Pingback: Visio Services in SharePoint 2010 – Part 2 « Dave Mc's Blog
Great article. Can you please give me detailed instructions of how you created the first example which shows two Visio Services diagrams on the same page within web parts? Thanks
Been a while ago now, suffice to say I created two Visio Services web parts, and populated them initially with two distinct Visio Diagrams. Using the Javascript API, I could pick up properties of specific shapes on each of the diagrams, so I picked out a Name property on each of the boxes in the top diagram, and using a standard bit of javascript, parsed the name into a URL for the lower digram. Again using the javascript API I hooked in the click event on the top diagram so that it would change the URL of the lower webpart, such that it would load the correct diagram, so clicking the “Europe” head of sales would load a diagram called “Europe”, “America” likewise. It’s all pretty straightforward really. Check out the http://msdn.microsoft.com/en-us/library/ff464325.aspx article on MSDN for details on the javascript API. Hope that helps.
I was interested on how to build the floor plan connected to a SharePoint list using Web Part Connections which allows you to highlight various areas like seating charts of the Visio Diagram. Can you please share information on how this was built…especially with the two web part connections…
Hi, I created a Custom Data Connection connected to an XML file and then created a Visio Services Webpart using the data from that. I ensured that one of the custom properties of the shapes in the diagram matched the names of people in a sharepoint list and then simply used standard SharePoint Webpart connections to bind them together.
Pingback: Access and Visio Services and Spatial Data in SharePoint 2010 - Ella Maschiach's BI Blog
Hey Dave, I’m working on building a dynamic seating arrangement for our staff. If you could give me some information on that telephone diagram that would be awesome. I’m working with SP2010 and VS2010 and Visio. Thanks for your time.
Hi Jeff,
Ping me a mail if you haven’t already completed your work! Apologies for the tardy reply – just been so busy, not had time to really attend to me blog! david dot mcmahon at ridgian dot co dot uk.
Cheers
Dave
Hello
i newn in sharepoint . i wnt know how to create visio .
Create a document in Microsoft Visio 2010 or 2013, ensure your SharePoint Farm has Visio Services switched on. If you’re not sure seek advice from your SharePoint Admin or whoever is fillign that role. Then simply upload your Visio diagram and click “View In Browser”. Job Done …